Hello stranger, and welcome! 👋😊
I'm Rasmus Bååth, data scientist, engineering manager, father, husband, tinkerer,
tweaker, coffee brewer, tea steeper, and, occasionally, publisher of stuff I find
interesting down below👇
The t-test is probably the most used and abused statistical test in research [ Citation Needed]. The t-test is used when you have two groups of measures and you want to look at the difference between the groups and the original t-test assumes that the measures are approximately normally distributed and that the two groups have equal variance. While this last assumption is relaxed by Welch’s t-test a large problem remains: The t-test isn’t Bayesian :)
Anscombe’s quartet is a collection of four datasets that look radically different yet result in the same regression line when using ordinary least square regression. The graph below shows Anscombe’s quartet with imposed regression lines (taken from
the Wikipedia article).
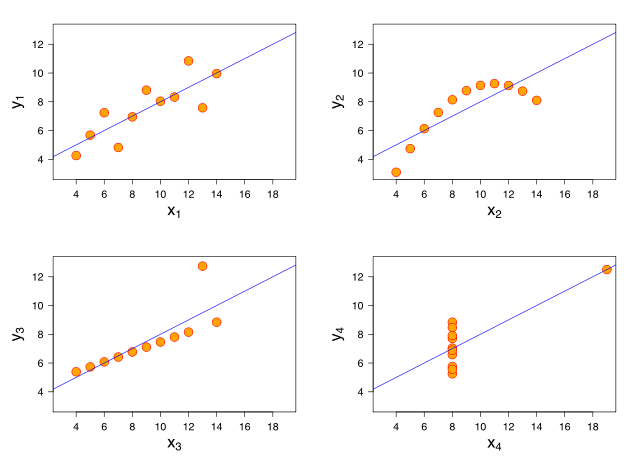
While least square regression is a good choice for dataset 1 (upper left plot) it fails to capture the shape of the other three datasets. In
a recent post John Kruschke shows how to implement a Bayesian model in
JAGS that captures the shape of both data set 1 and 3 (lower left plot). Here I will expand that model to capture the shape of all four data sets. If that sounds interesting start out by reading
Kruschke’s post and I will continue where that post ended…
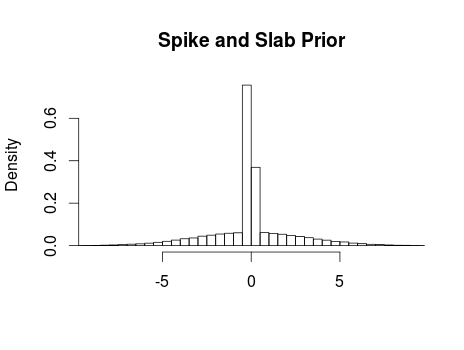
Ok, using a wide tailed t distribution it was possible to down weight the influence of the outlier in dataset 3 while still capturing the shape of dataset 1. It still fails to capture datasets 2 and 4 however. Looking at dataset 2 (upper right plot) it is clear that we would like to model this as a quadratic curve and what we would like to do is to allow the model to include a quadratic term when the data supports it (as dataset 2 does) and refrain from including a quadratic term when the data supports a linear trend (as in datasets 1 and 3). A solution is to include a quadratic term (b2) with a spike and slab prior distribution which is a mixture between two distributions one thin (spiky) distribution and one wide (slab) distribution. By centering the spike over zero we introduce a bit of automatic model selection into our model, that is, if there is evidence for a quadratic trend in the data then the slab will allow this trend to be included in the model, however, if there is little evidence for a quadratic trend then the spike will make the estimate of b2 practically equivalent to zero. In JAGS such a prior can be implemented as follows:
b2 <- b2_prior[b2_pick + 1]
b2_prior[1] ~ dnorm(0, 99999999999999) # spike
b2_prior[2] ~ dnorm(0, 0.1) # slab
b2_pick ~ dbern(0.5)
The argument to the dbern function indicates our prior belief that the data includes a quadratic term, in this case we think the odds are 50/50. The resulting prior looks like this:
Have you ever wondered if children prefer bananas over candy or when their fascination for dinosaurs kick in? These are the kinds of questions you can get answered on my new webpage ChildFreq. Using a huge child language database ChildFreq shows you what words children use at what age. Let’s look at some querries and let’s start with banana vs. candy.
Seems like Banana start out as the leader but then Candy gains speed, passes Banana at around 30 months and finishes as the winner with a good marginal, go Candy!
A short paper I presented at the International Conference on New Interfaces for Musical Expression (NIME), 30 May – 1 June 2011, Oslo, Norway. This paper was heavily inspired by Hornof, A., & Vessey, K. (2011).
Abstract The aim of this study was to investigate how well subjects beat out a rhythm using eye movements and to establish the most accurate method of doing this. Eighteen subjects participated in an experiment were five different methods were evaluated.
After much googling I finally found a copy of Robert MacDougall’s “The Structure of Simple Rhythm forms” from 1903. It was hidden in Harvard Psychological Studies, Volume 1 now freely available from Project Gutenberg ( https://www.gutenberg.org/ebooks/16266 . Since it seems the book is now in the public domain I took the liberty to convert “The Structure of Simple Rhythm forms” into pdf-format and post it here so that it might be more easily found in the future.
A short paper I presented at the 12th International Conference on Music Perception and Cognition , Thessaloniki, Greece. A great conference, by the way, except for the heat...
Abstract The current study investigates the slower limit of rhythm perception and participants subjective difficulty when tapping to a slow beat. Thirty participants were asked to tap to metronome beats ranging in tempo from 600 ms to 3000 ms between each beat. After each tapping trial the participants rated the difficulty of keeping the beat on a seven point scale ranging from “very easy” to “very difficult”.
I’ve used the really sweet Arduino prototyping platform to construct a high precision, low latency tapping board to be used when measuring finger tapping. The details are found in this technical report.
Abstract This technical report describes the construction of a tapping board to be used in sensorimotor synchronization tasks where the timing of participants’ taps are to be registered. The tapping board is designed to be comfortable to use and to register taps with millisecond accuracy.