As spring follows winter once more here down in southern Sweden, the two sample t-test follows the one sample t-test. This is a continuation of the Bayesian First Aid alternative to the one sample t-test where I’ll introduce the two sample alternative. It will be a quite short post as the two sample alternative is just more of the one sample alternative, more of using John K. Kruschke’s BEST model, and more of the coffee yield data from the 2002 Nature article The Value of Bees to the Coffee Harvest.
![]()
Bayesian First Aid is an attempt at implementing reasonable Bayesian alternatives to the classical hypothesis tests in R. For the rationale behind Bayesian First Aid see the original announcement. The development of Bayesian First Aid can be followed on GitHub. Bayesian First Aid is a work in progress and I’m grateful for any suggestion on how to improve it!
The Model
The model is a straight forward extension of the one sample Bayesian Estimation Supersedes the T-test (BEST), instead of estimating the distribution of one group $x_i$ we now estimate the distributions of two, $x_i$ and $y_j$. As before we use the t-distribution as a robust alternative to the normal distribution and we assume non-informative priors. The degree-of-freedoms parameter $\nu$ governs how fat the tails of the t-distribution are and could be estimated separately for each group. Here we instead assume the two groups share a common $\nu$ resulting in a model with five parameters: $\mu_x, \mu_y, \sigma_x, \sigma_y$, and $\nu$. Here is the full model for the two sample BEST, shown using a Kruschke style diagram:
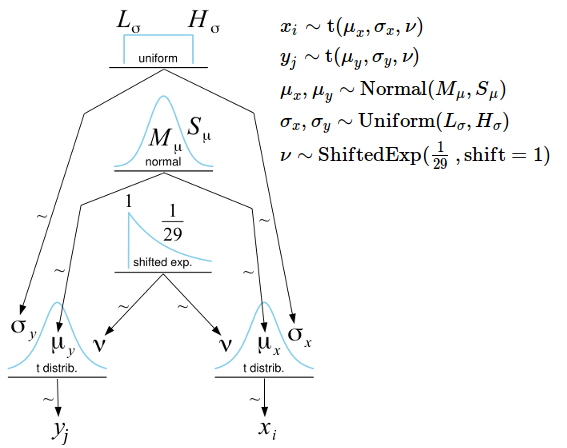
(If you want to know more about Kruschke style diagrams and how you can easily make them check out DIY Kruschke Style Diagrams and How Do You Write Your Model Definitions?)
The bayes.t.test Function for Paired Samples
The bayes.t.test function can be called exactly as the t.test function in R. If you just ran t.test(x, y, conf.level=0.9), a two sample t-test yielding a 90% CI, prepending bayes. runs the Bayesian First Aid alternative: bayes.t.test(x, y, conf.level=0.9). To showcase bayes.t.test I’ll use the same data as
last time, the coffee yield data from the 2002 Nature article The Value of Bees to the Coffee Harvest (
doi:10.1038/417708a,
pdf). In that article David W. Roubik argues that, while the coffee bush is self pollinating, having African honeybees around still increases the coffee yield. This argument is supported by a data set with by-country coffee yields from the periods 1961 to 1980 and 1981 to 2001. Here is the data set shown using a
Slopegraph:
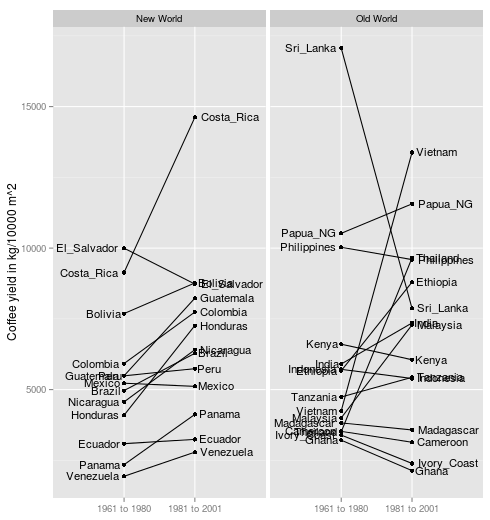
The thing is, in the 60s the African honeybee had not yet settled in the New World, something that happened in the period 1981 to 2001. Roubik then argues that the data shows that…
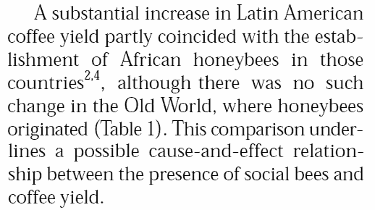
Here “substantial increase in Latin America” refers to a statistically significant mean increase of 1470 kg/10,000² (paired samples t-test, p = 0.004) while “no such change in the Old World” refers to a non-significant mean increase of 777 kg/10,000² (p = 0.23). Roubik makes the classical mistake of assuming that the difference between “significant” and “not significant” is itself statistically significant ( Gelman & Stern, 2006, explains why it’s not). What should be compared is not the p-values but the increase in coffee yield in the Old and New World. Let’s do just that using the Bayesian First Aid alternative to the two sample t-test.
First I’ll load in the data (available here) and calculate the difference in yield between the 1960 to 1981 period and the 1981 to 2000 period for each country:
d <- read.csv("roubik_2002_coffe_yield.csv")
yield_diff_new <- with(d[d$world == "new", ], yield_81_to_01 - yield_61_to_80)
yield_diff_old <- with(d[d$world == "old", ], yield_81_to_01 - yield_61_to_80)
The boxplot below shows the distribution of the yield differences.
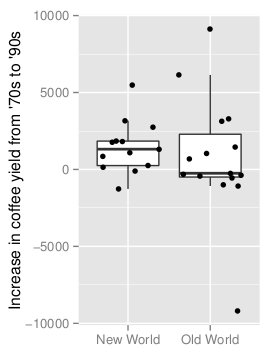
We’ll now compare the increase in yields using the Bayesian First Aid alternative to the two sample t-test.
library(BayesianFirstAid)
bayes.t.test(yield_diff_new, yield_diff_old)
##
## 	Bayesian estimation supersedes the t test (BEST) - two sample
##
## data: yield_diff_new (n = 13) and yield_diff_old (n = 15)
##
##   Estimates [95% credible interval]
## mean of yield_diff_new: 1386 [396, 2460]
## mean of yield_diff_old: 738 [-1305, 2788]
## difference of the means: 649 [-1593, 2997]
## sd of yield_diff_new: 1678 [785, 2605]
## sd of yield_diff_old: 3608 [1384, 5776]
##
## The difference of the means is more than 0 by a probability of 0.728
## and less than 0 by a probability of 0.272
The estimated difference of the means show that New World type countries increase their coffee yield by 649 kg/10,000² more than Old World type countries. The 95% credible interval is however fairly wide spanning all the way from -1593 to 2997, thus there is no strong evidence that the introduction of African honeybees in the New World resulted in a larger yield increase than in the Old World. The 2002 Nature article contains other arguments for the importance of bees to the coffee harvest, however, the argument based on the difference between New World and Old World coffee yields does not hold in the light of this analysis. (Not to mention other problems with the original analysis such as not considering that something other than the introduction of African bees might have changed in the New World from 1960 to 2001.)
Generic Functions
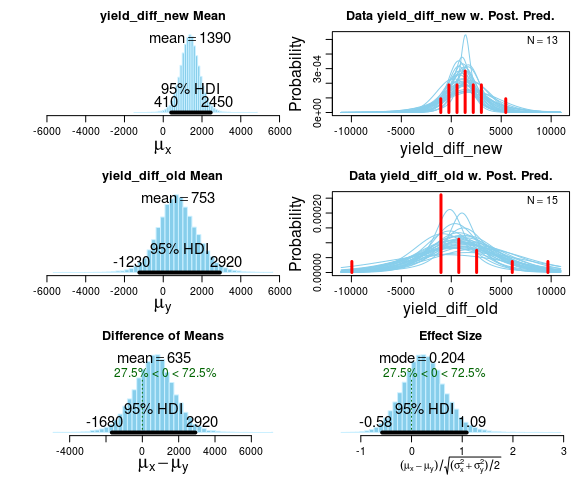
Every Bayesian First Aid test have corresponding plot, summary, diagnostics and model.code functions. Here follows examples of these using the same coffee yield data as above. Using plot we get to look at the posterior distributions directly. We also get a posterior predictive check in the form of a histogram with a smattering of t-distributions drawn from the posterior.
fit <- bayes.t.test(yield_diff_new, yield_diff_old)
plot(fit)
summary gives us a detailed summary of the posterior of the parameters and derived quantities. For this model there will be a lot of output! One thing to note is that while there is little evidence of a difference in means between New and Old World type countries, there is some evidence for a difference in SD (check out the posterior of sigma_diff)
summary(fit)
##   Data
## yield_diff_new, n = 13
## yield_diff_old, n = 15
##
##   Model parameters and generated quantities
## mu_x: the mean of yield_diff_new
## sigma_x: the standard deviation of yield_diff_new
## mu_y: the mean of yield_diff_old
## sigma_y: the standard deviation of yield_diff_old
## mu_diff: the difference in means (mu_x - mu_y)
## sigma_diff: the difference in SD (sigma_x - sigma_y)
## nu: the degrees-of-freedom for the t distribution
##   fitted to yield_diff_new and yield_diff_old
## eff_size: the effect size calculated as
##   (mu_x - mu_y) / sqrt((sigma_x^2 + sigma_y^2) / 2)
## x_pred: predicted distribution for a new datapoint
##   generated as yield_diff_new
## y_pred: predicted distribution for a new datapoint
##   generated as yield_diff_old
##
##   Measures
##                 mean       sd     HDIlo     HDIup %<comp %>comp
## mu_x        1388.299  511.968   409.899  2449.567  0.006  0.994
## sigma_x     1679.405  474.933   810.741  2648.732  0.000  1.000
## mu_y         753.183 1047.502 -1232.772  2923.357  0.220  0.780
## sigma_y     3632.357 1146.042  1398.169  5878.624  0.000  1.000
## mu_diff      635.116 1159.982 -1681.665  2919.615  0.275  0.725
## sigma_diff -1952.952 1139.910 -4212.613   231.122  0.971  0.029
## nu            22.382   26.350     1.003    74.391  0.000  1.000
## eff_size       0.252    0.427    -0.580     1.088  0.275  0.725
## x_pred      1402.767 2517.321 -2802.005  5778.093  0.217  0.783
## y_pred       767.622 6505.562 -8142.650 10098.388  0.423  0.577
##
## 'HDIlo' and 'HDIup' are the limits of a 95% HDI credible interval.
## '%<comp' and '%>comp' are the probabilities of the respective parameter being
## smaller or larger than 0.
##
##   Quantiles
##                q2.5%      q25%   median      q75%   q97.5%
## mu_x         386.664  1060.628  1381.88  1706.548 2434.865
## sigma_x      896.541  1358.708  1626.46  1938.288 2785.885
## mu_y       -1271.465    90.040   722.09  1397.014 2891.165
## sigma_y     1564.286  2882.708  3569.03  4286.617 6157.730
## mu_diff    -1700.441   -94.802   649.95  1366.319 2903.388
## sigma_diff -4475.703 -2605.838 -1870.92 -1195.454   55.286
## nu             1.660     5.095    12.66    29.575   94.284
## eff_size      -0.548    -0.033     0.24     0.518    1.132
## x_pred     -2879.647   204.561  1384.25  2573.740 5712.500
## y_pred     -8288.402 -1806.682   698.90  3321.216 9979.543
diagnostics will give us an equally long list of MCMC convergence diagnostics and traceplots. Finally model.code prints out R and JAGS code that replicates the analysis and that can be directly copy-n-pasted into an R script and modified from there. It is also pretty long but here goes:
model.code(fit)
## Model code for Bayesian estimation supersedes the t test - two sample ##
require(rjags)

# Setting up the data
x <- yield_diff_new
y <- yield_diff_old

# The model string written in the JAGS language
model_string <- "model {
  for(i in 1:length(x)) {
    x[i] ~ dt( mu_x , tau_x , nu )
  }
  x_pred ~ dt( mu_x , tau_x , nu )
  for(i in 1:length(y)) {
    y[i] ~ dt( mu_y , tau_y , nu )
  }
  y_pred ~ dt( mu_y , tau_y , nu )
  eff_size <- (mu_x - mu_y) / sqrt((pow(sigma_x, 2) + pow(sigma_y, 2)) / 2)
  mu_diff <- mu_x - mu_y
  sigma_diff <-sigma_x - sigma_y

  # The priors
  mu_x ~ dnorm( mean_mu , precision_mu )
  tau_x <- 1/pow( sigma_x , 2 )
  sigma_x ~ dunif( sigmaLow , sigmaHigh )

  mu_y ~ dnorm( mean_mu , precision_mu )
  tau_y <- 1/pow( sigma_y , 2 )
  sigma_y ~ dunif( sigmaLow , sigmaHigh )

  # A trick to get an exponentially distributed prior on nu that starts at 1.
  nu <- nuMinusOne+1
  nuMinusOne ~ dexp(1/29)
}"

# Setting parameters for the priors that in practice will result
# in flat priors on the mu's and sigma's.
mean_mu = mean( c(x, y), trim=0.2)
precision_mu = 1 / (mad( c(x, y) )^2 * 1000000)
sigmaLow = mad( c(x, y) ) / 1000
sigmaHigh = mad( c(x, y) ) * 1000

# Initializing parameters to sensible starting values helps the convergence
# of the MCMC sampling. Here using robust estimates of the mean (trimmed)
# and standard deviation (MAD).
inits_list <- list(
  mu_x = mean(x, trim=0.2), mu_y = mean(y, trim=0.2),
  sigma_x = mad(x), sigma_y = mad(y),
  nuMinusOne = 4)

data_list <- list(
  x = x, y = y,
  mean_mu = mean_mu,
  precision_mu = precision_mu,
  sigmaLow = sigmaLow,
  sigmaHigh = sigmaHigh)

# The parameters to monitor.
params <- c("mu_x", "mu_y", "mu_diff", "sigma_x", "sigma_y", "sigma_diff",
            "nu", "eff_size", "x_pred", "y_pred")

# Running the model
model <- jags.model(textConnection(model_string), data = data_list,
                    inits = inits_list, n.chains = 3, n.adapt=1000)
update(model, 500) # Burning some samples to the MCMC gods....
samples <- coda.samples(model, params, n.iter=10000)

# Inspecting the posterior
plot(samples)
summary(samples)
Bayesian Estimation Supersedes the T-test (BEST) Online
In addition to using the two sample BEST as the Bayesian First Aid alternative to the t-test I’ve also implemented a javascript version that allows you to estimate this model directly in your browser using MCMC. Head over to https://sumsar.net/best_online/ and try it out with the same coffee yield data as in the examples above (just copy-n-paste from below), it should (hopefully) result in similar estimates.
### Increase in Coffee yield for the New World countries
5481 1081 -1267 2743 1820 3168 1842 1318 253 -111 1777 151 851

### Increase in Coffee yield for the Old World countries
9129 1039 6143 -435 3130 -9195 1450 3287 -549 694 -322 -248 -384 -1002 -1077
The javascript implementation uses a difference MCMC algorithm than the R & JAGS version where the burn in period is also used for tuning the sampler. In the case with the coffee data I would recommend increasing the burn in period to 40000 (or decrease it to 1 to see how badly behaving MCMC sampling looks).