I argued recently that a good way of communicating statistical models graphically was by using the convention devised by John K. Kruschke in his book Doing Bayesian Data Analysis. John Kruschke describes these diagrams in more detail on his blog: here, here and here. While I believe these kinds of diagrams are great in many ways there is a problem in that they are quite tricky to make. That is, until now!
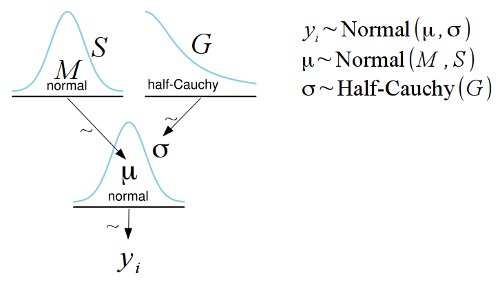
I have put together a template for the free and open source LibreOffice Draw which makes it simple to construct Kruschke style diagrams such as the one below:
The template is available for download here and a couple of extra distributions that didn’t make it into the template is available here. The template is pretty easy to use but to get a head start you might want to watch this screencast that I’ve made:
If you want full control over how the distribution pictograms look, or if you want to use another program to make this type of diagram, you can get the distribution images here in png and svg format.
Update: Tinu Schneider also shows how to use $\LaTeX$ to draw Kruschke style diagrams here.